
INTRODUCTION
For my project I’m looking into the physics of wind chimes. I want to know what parameters determine the frequency of a metal pipe. I’m also going to examine the phenomenon known as “edge-effects” and attempt to explain what causes this.
The first step of my project was to find some suitable wind chimes so I headed over to the Mega Kroger with my roommates. There was a whole assortment of wind chimes to choose from. It was a little overwhelming as I’m not the best at making quick decisions. “What material do I want to use? These are pretty cheesy, I don’t want those. How many pipes do I need? These ones are too pretty; I’d feel bad taking them apart. I don’t like how these sound.” Eventually I realized I was making a scene from setting off all the chimes at once. I picked a steel set of six pipes that sounded alright and then ran off to annoy my roommates while they grocery shopped by following behind them with a loud wind chime.
DATA TAKING
When I got home I got to work decapitating the chimes. I used the audio editing program Audacity to analyze the data. I took each pipe, dropped it on a glass vase, and recorded the sound. Audacity has a really nice feature where it automatically takes a recording and plots the loudness versus frequency for you. This is shown below on a logarithmic frequency axis. The first distinct peak represents the first fundamental frequency of the pipe and the following peaks are the corresponding harmonics. For this project I’m only interested in the fundamental frequencies though.
The lengths of my pipes are :
Pipe 1 = 20.0 cm
Pipe 2 = 21.5 cm
Pipe 3 = 23.0 cm
Pipe 4 = 24.5 cm
Pipe 5 = 26.0 cm
Pipe 6 = 27.5 cm
The x-axis is frequency in Hertz and the y-axis is the loudness in Decibels.

Pipe 1

Pipe 2

Pipe 3

Pipe 4

Pipe 5

Pipe 6
From these plots I can directly determine the frequency of each pipe. Now I want to plot these frequencies against the length of the pipe.

At first glance, it appears that this is a power law relation. Just by simple least squares regression in Excel I determined this relation between frequency and length for my data:
![]()
SCIENCE!
Now comes the hard part: Why does this happen? What parameters determine the frequency of a pipe? From the diagram below you can see how the length of a pipe determines the wavelength and frequencies of sound waves [1].

Therefore f = (v_s * n) / (2L), where v_s is the speed of sound in air.
This explains the frequency of the air moving longitudinally inside the pipe. Now this equation would suffice if we were investigating the frequencies produced by a flute or trumpet, but with a wind chime, it’s actually the metal vibrating itself that creates the sound, not the air inside. This is a bit more complicated. This is where we need to factor in the dimensions and material of each pipe.
This relationship is less intuitive. However, after I rooted around quite a bit on the internet and talked to some people I found exactly what I needed. The frequency of a pipe is determined by one of Euler’s equations [2].

Where:
n = the harmonic number
E = the modulus of elasticity (Basically measures how stiff a material is)
I = the moment of Inertia [ I = (1/8)( Pi * d^3 * t) for a thin-walled tube]
d = diameter of tube and t = the tube thickness
ρ = the mass per unit length =Pi * d * t * density
L = length of tube
If you ignore the constants, the frequency is simply proportional to the inverse square of the length of the pipe:

Plugging in the equations for the moment of inertia and the mass per unit length the frequency formula can be simplified to:
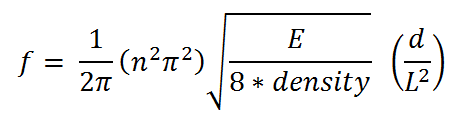
For my pipes I found the following values:
n = 1
E = 2,068,427,184 [kg / (cm s^2)]
Density = 0.00805 [kg / cm^3]
Diameter = 1.15 cm
Now I can plot the expected values for the frequencies versus length of pipe.

The theoretical frequencies of my pipes are shown in green while my data is shown in blue. My empirically derived relationship is extrapolated to fully show how it relates to the theoretical relationship. At small values of L my data is about 80% the expected value. But it appears that as the length of the pipe increases the data approaches the theoretical value.
This phenomenon could possibly be explained by so-called “edge-effects”. Inside the pipe the air column is confined to move within the walls of the pipe. But at the edges the air is free to move outside its confines and vibrate the air just outside the end of the pipe. This creates an illusion that the pipe is appearing to be longer than it actually is. That vibrating air at the ends behaves the same as if it were inside the pipe. As we saw above, the frequency of a standing wave is inversely proportional to the length of the pipe. In other words: the longer the pipe the lower the frequency of the sound wave.
However, these edge effects shouldn’t change the peak frequencies of the pipe. The edge effects contribute to the overall tone of a musical chime, but the peak frequency will remain constant.
Why is this phenomenon more extreme at smaller pipe lengths? Remember that the diameter of the pipes remains constant for all lengths. Also remember that these wind chimes are made from cheap material and probably contain many impurities. For example, there are holes drilled into the top for the supporting string. For large lengths these impurities don’t contribute significantly toward the final results, but for smaller lengths the phenomenon is more important.
CONCLUSIONS
From a mathematical view, in order to account for the discrepancy one simply needs to multiply the theoretical equation by 0.68 * L^(0.073). This is an obviously very small amount and the relation can be excellently approximated without this correction.
The detailed explanation of the derivation of this correction is a project for another day. My empirical result should be satisfactory for constructing simple models tuned around a similar frequency. It would be interesting to take more data at farther frequencies and see how the correction is affected. Perhaps at very small pipe lengths a completely different relationship would emerge due to this phenomenon controlling the outcomes.
Wind chimes are physically quite interesting objects. When I was searching for information on the science behind their creation I found lots of interesting blogs which go more into the details of the musical side and also how to create your own. My personal favorite was a man who got giant 4.5 foot pipes and tuned them to a minor key to create a monstrous, ominous wind chime.
Some Interesting Blogs on Wind Chimes:
[1] http://milwaukeemakerspace.org/2011/09/giant-ominous-wind-chimes/
[2] https://sites.google.com/site/chuckchimes/
References
[1] http://hedberg.web.cern.ch/hedberg/c/oscillation/oscillation_hl.htm#1
